Site to Site Analysis
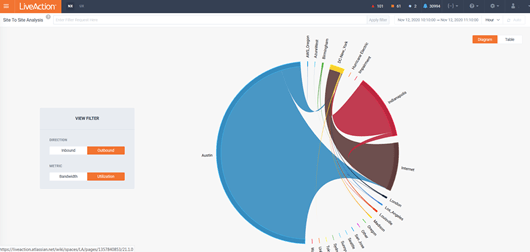
The Site to Site Analysis story provides a chord diagram for understanding the bandwidth/ utilization between sites.
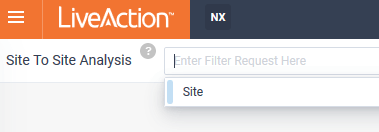
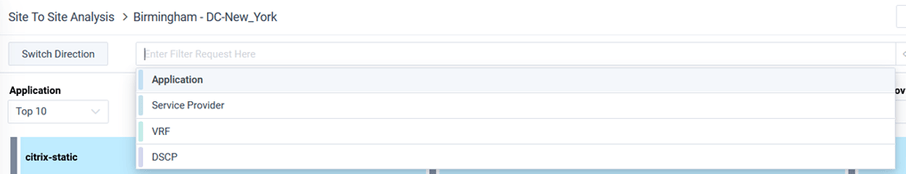
Filters can be applied to focus on the specific conversations of interest:
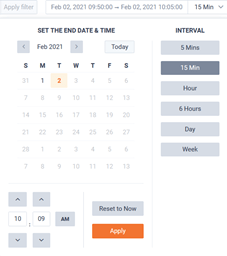
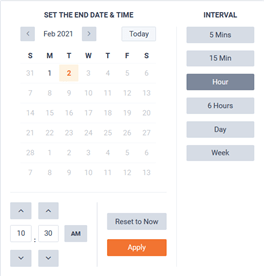
Historic time ranges can be selected for finding the Flows of interests.
The page can optionally be auto-refreshed by toggling the button in the top right of the page.

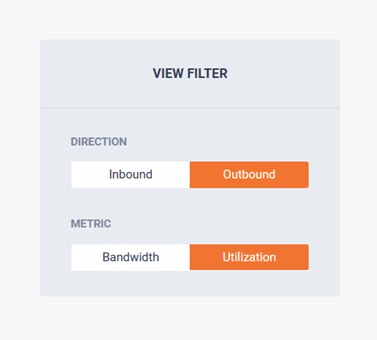
A View Filter is available for controlling the Flow’s direction and metric in the diagram.
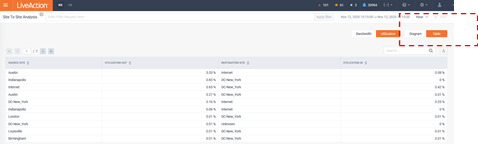
The story can be displayed as either a Chord Diagram or Table.
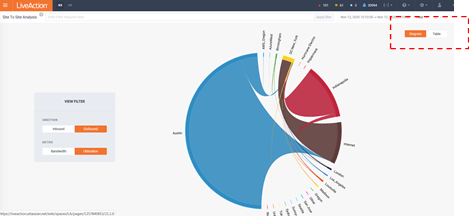
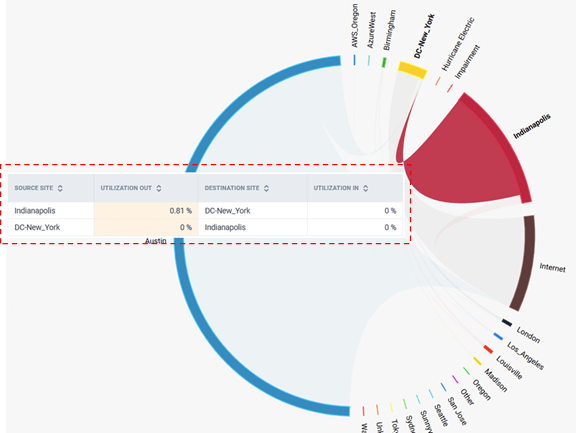
Highlighting a chord will show the details of the bandwidth/ utilization between the sites highlighted. Clicking on a chord will launch a Sankey diagram.
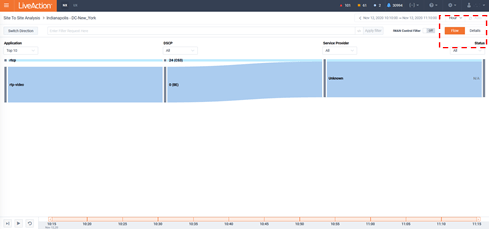
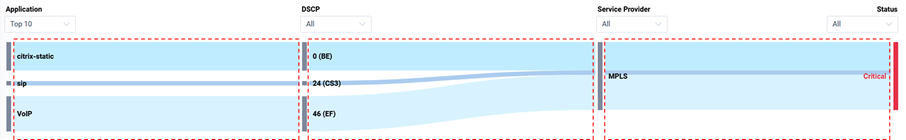
The Site To Site story Sankey diagram provides further details on the bandwidth/utilization between the sites selected.
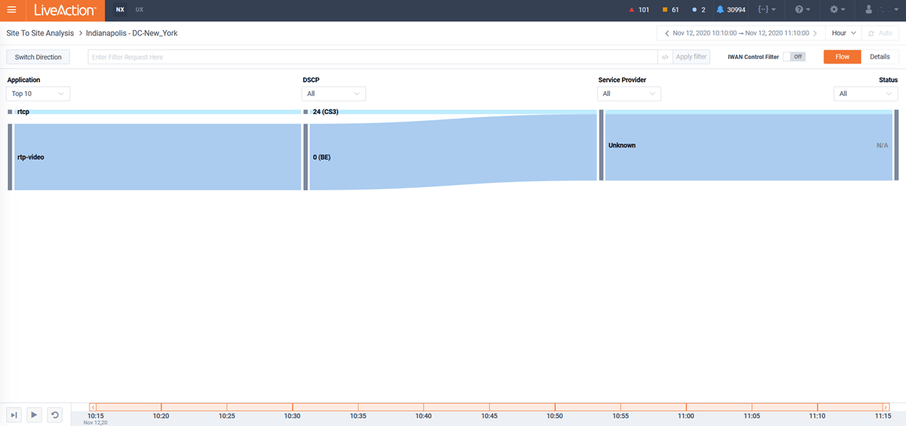
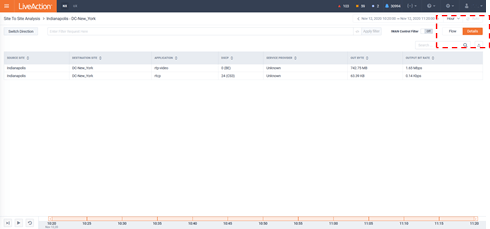
The Sankey diagram can be viewed in either a Flow or Details view.
Filters can be applied to focus on the specific conversations of interest:
Historic time ranges can be selected for finding the Flows of interests.
The page can optionally be auto-refreshed by toggling the button in the top right of the page.
The Sankey diagram highlights the applications, their DSCP, the service provider path the application took, and its status. Clicking on the chords in the Sankey diagram will pivot to a curated historic report template.
This template includes the following reports:
• Application
• DSCP
• App Group (DSCP) by Service Provider
• Jitter/ Loss
• Application Performance (AVC)
• Service Provider Performance (PfR)
Filters located at the top of the Sankey diagram can be used to further refine the data shown.
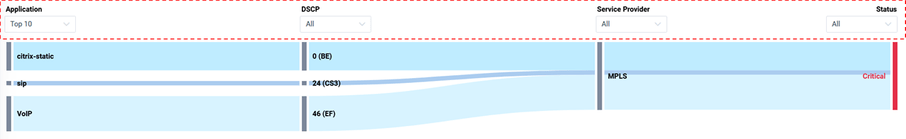
The IWAN Control Filter can be used to hide IWAN Smartprobe traffic on the Sankey diagram.

The button can be used to reverse the source/destination site visualized in the Sankey diagram.

A timeline slider is available at the bottom of the Sankey diagram to understand the context over time.

Advanced to next bin window:

“Play” the Sankey Diagram bin by bin:

“Pause” the Sankey Diagram on the current bin:

Reset view to complete time window:
